
OverView
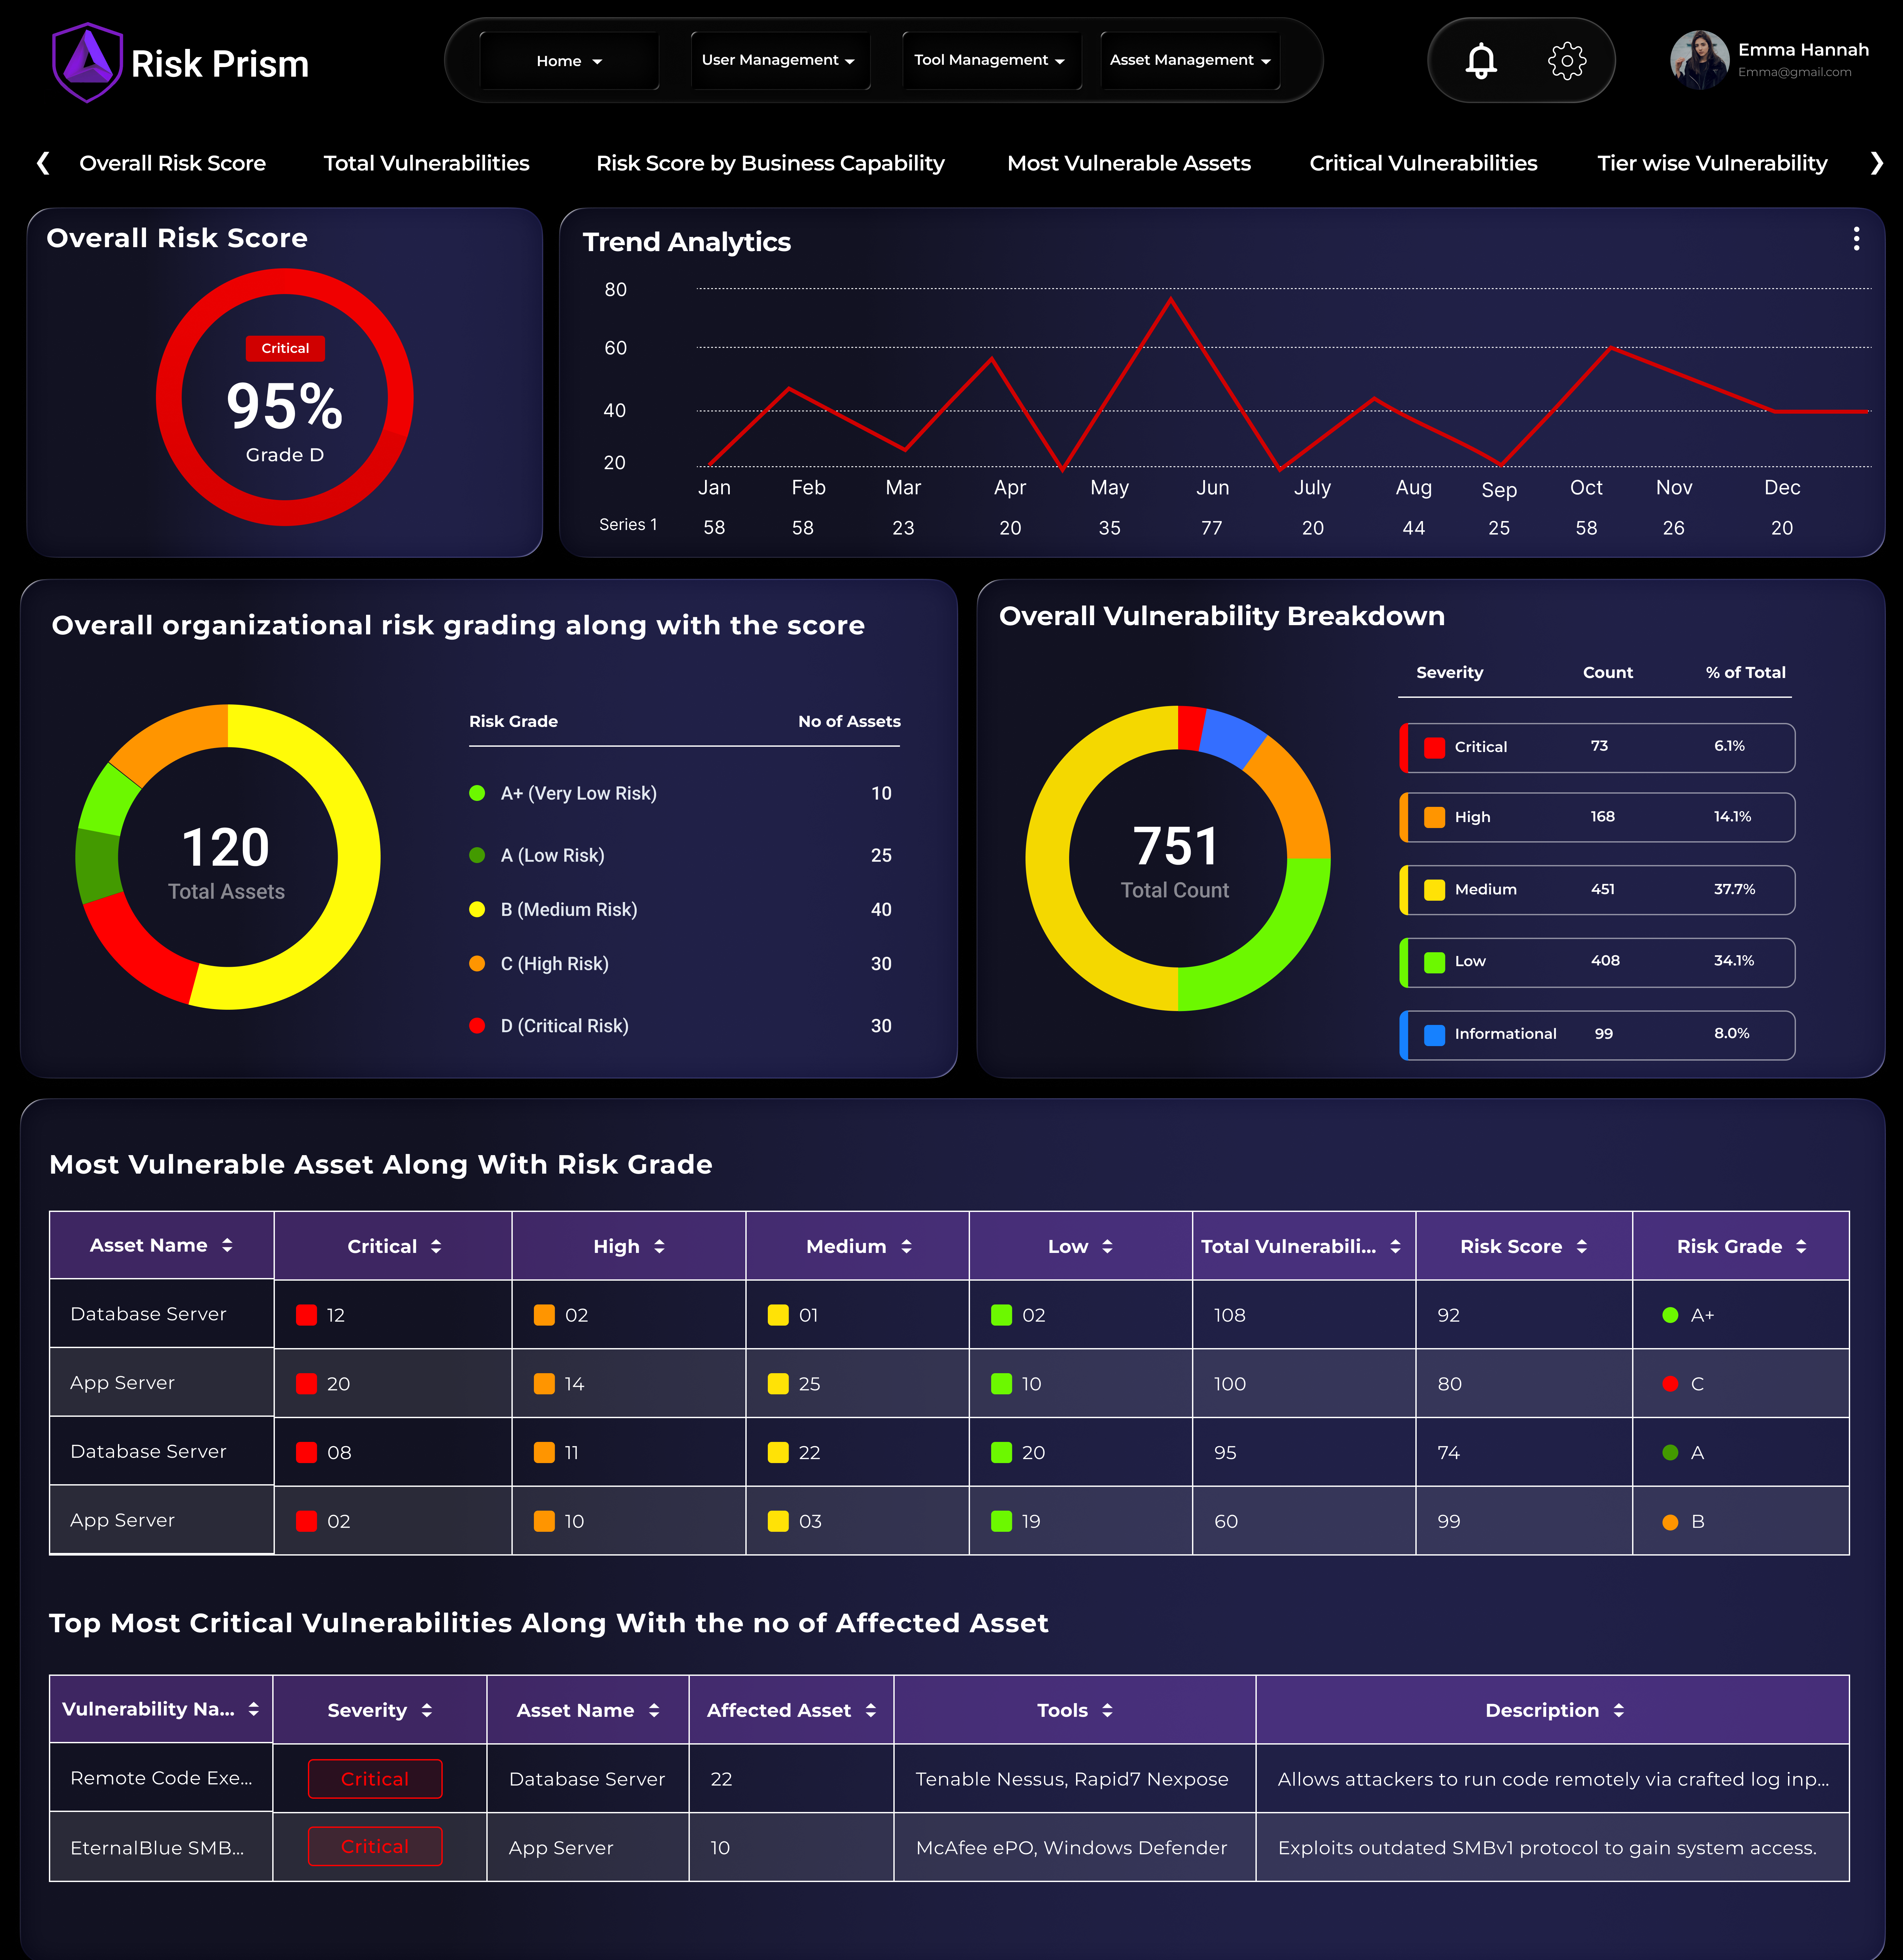
RiskPrism’s Interactive Dashboards provide real time visibility into vulnerabilities, asset exposure, remediation performance, and threat activity across your environment. Designed for CISOs, SOC teams, and DevSecOps, the dashboards transform raw scanner output into actionable insights using contextual risk scoring, visual analytics, and drill down data exploration.
How It Works
Data from scanners, cloud platforms, and threat intelligence feeds is ingested into RiskPrism’s analytics layer, where it is normalized, correlated, and scored. The dashboards then visualize this enriched data using dynamic widgets, trend charts, heat maps, and asset level drilldowns. Each view updates in real time as new vulnerabilities are detected, tickets are resolved, or risk scores change.
Key Capabilities
- Real-time organization, tier, and asset-level risk scoring
- Heat maps showing risk concentration across departments or business tiers
- Vulnerability aging, backlog status, and MTTR tracking
- Asset dependency graphs and inherited-risk mapping
- Exploit likelihood overlays using CISA KEV + EPSS
- SLA and remediation performance dashboards with ticket status
- Export to PDF, CSV, or embed via API
Benefits
- Enables faster, more accurate vulnerability prioritization
- Reduces manual analysis with automated scoring and correlation
- Improves collaboration across SOC, IT, and DevSecOps teams
- Provides executive-ready reporting for board and compliance reviews
- Helps identify the highest-risk assets and bottlenecks instantly
- Aligns remediation work with business impact not just CVSS scores